PREPINSTA PRIME
How to solve Bar Chart Quickly
Solve Bar Chart Quickly
Here, On this page you will get to learn about How to Solve Bar Chart Quickly and easily with help of rules and formulas.
A bar chart is a type of graph that uses rectangular bars to represent data. The length of each bar is proportional to the value of the data it represents.

How to solve Bar Chart Quickly
Concepts for Bar Chart
- Category: Each distinct item or group being compared in the bar chart is referred to as a category.
- Data Series: In bar charts with multiple bars per category, each group of bars that represents a specific dataset or variable is called a data series.
- Baseline: The baseline is the reference line from which the bars start. In a vertical bar chart, it’s usually the x-axis, and in a horizontal bar chart, it’s the y-axis.
- Horizontal axis: The axis that represents the categorical feature in a bar chart.
- Vertical axis: The axis that represents the numeric value in a bar chart.
- Bar length or height: The length or height of a rectangular bar in a bar chart that represents the value of the data.
- Scale: A system of markings spaced at specific intervals that aid in object measurement.
- Class intervals: A range of values that are grouped together for analysis and presentation in a bar chart.
Steps to extract information from Bar Chart
Step 1: Write the title of the graph.
Step 2 : Draw and Label Both the Axis of the Graph.
Step 3 : Plot the Data Elements.
Step 4 : Plot Given Element Provided in Data.
Step 5 : Draw the bars for each category, with the height of each bar corresponding to the value it represents.
Prime Course Trailer
Related Banners
Get PrepInsta Prime & get Access to all 200+ courses offered by PrepInsta in One Subscription
Also Check Out
Questions and Answers to Solve for Bar Chart quickly
Common Data Question for 1 to 5
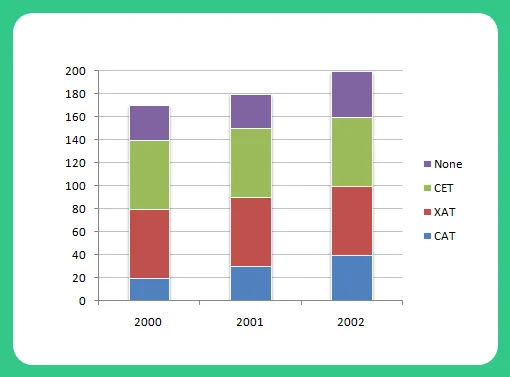
The following chart represents the number of students who passed the CAT exam or the XAT exam or the CET exam or None of these exams conducted by Education Minister, Dharmendra Pradan. (Assume that there are no students who passed more than one exam.)
Number of students who qualified CAT/XAT/CET Exams

Question 1.
Which year showed the best result in MBA entrance exams (in terms of percentage of students who cleared) ?
A. 2000
B. 2001
C. 2002
D. Cannot be determined
Answer: Option B
Explanation:
Compare the respective pass percentage for three years : 2000, 2001 and 2002
= \frac{140}{170}\times 100 < \frac{150}{180}\times 100 and \frac{150}{180}\times 100 > \frac{160}{200}\times 100
= 82.35% < 83.33% and 83.33% > 80%
Question 2.
What was the percentage of students who succeeded in at least one of three exams in 2000 ?
A. 82.4 %
B. 82.8 %
C. 82.35 %
D. 83.3 %
Answer: Option C
Explanation:
Total percentage of students who succeeded in at least one of three exams in 2000 =\frac{140}{170}\times 100 = 82.35 %
Question 3.
What is the percentage increase in the number of students in 2002 over 2000 ?
A. 30 %
B. 17.64 %
C. 117.6 %
D. 85 %
Answer: Option B
Explanation:
Total percentage increase in the number of students in 2002 over 2000 is = \frac{30}{170}\times 100 = 17.64 %
Question 4.
What is the percentage of students who cleared CAT in 2000 ?
A. 19.56 %
B. 12.65 %
C. 14.28 %
D. 11.76 %
Answer: Option D
Explanation:
Total percentage of students who cleared CAT in 2000 = \frac{20}{170}\times 100= 11.76 %
Question 5.
What was the percentage of students who succeeded in at least one of three exams in 2002 ?
A. 80 %
B. 78.5 %
C. 84 %
D. 81.6 %
Answer: Option A
Explanation:
Total percentage of students who succeeded in at least one of three exams in 2000 =\frac{160}{200}\times 100 = 80 %
Also Check Out
Get over 200+ course One Subscription
Courses like AI/ML, Cloud Computing, Ethical Hacking, C, C++, Java, Python, DSA (All Languages), Competitive Coding (All Languages), TCS, Infosys, Wipro, Amazon, DBMS, SQL and others

Series
- Line Charts – Questions Formulas | How to Solve Quickly | Tricks & Shortcuts
- Pie Charts – Questions | Formulas | How to Solve Quickly | Tricks & Shortcuts
- Bar Charts – Questions | Formulas | How to Solve Quickly | Tricks & Shortcuts
- Radar Charts – Questions | Formulas | How to Solve Quickly | Tricks & Shortcuts

Series
- Line Charts – Questions
Formulas |
How to Solve Quickly |
Tricks & Shortcuts - Pie Charts – Questions |
Formulas |
How to Solve Quickly |
Tricks & Shortcuts - Bar Charts – Questions |
Formulas |
How to Solve Quickly |
Tricks & Shortcuts - Radar Charts – Questions |
Formulas |
How to Solve Quickly |
Tricks & Shortcuts

 Apply For Jobs
 Get Hiring Updates


Login/Signup to comment