PREPINSTA PRIME
Bar Chart Formulas
Formulas for Bar Chart in DI
Here , In this Page Formulas of Bar Chart in Data Interpretation is given.
Formulas for Bar Chart
Types of Bar Chart
There are 3 main types of bar charts:
1. Vertical bar graph: This is the most commonly used bar graph, where the bars are plotted vertically. It represents the grouped data vertically.
2. Horizontal bar graph: In this type of bar graph, the bars are plotted horizontally. It is used to compare data sets that are independent of one another.
3. Double bar graph: It is a graphical representation of data that uses two parallel bars of varying heights to display two sets of data on the same graph. The bars can be arranged either vertically or horizontally.
Properties of Bar Chart:
- The gap between one bar and another is uniform . It can be either horizontal or vertical.
- The bars are of uniform width, and the variable quantity is represented on one of the axes.
- The scale of the bar graph shows the way in which numbers are used in the data. It is a system of marks at fixed intervals that aid in object measurement.
Applications of Bar Chart:
- Comparing summary statistics between categories
- Comparing different groups over time
- Displaying a variable function (sum, average, standard deviation) by categories
- Comparing different categorical or discrete variables, such as age groups, classes, schools, etc.
- Showing time series data
Prime Course Trailer
Related Banners
Get PrepInsta Prime & get Access to all 200+ courses offered by PrepInsta in One Subscription
Also Check Out
Bar Chart Formula Based Questions
Common data Question from 1 to 5
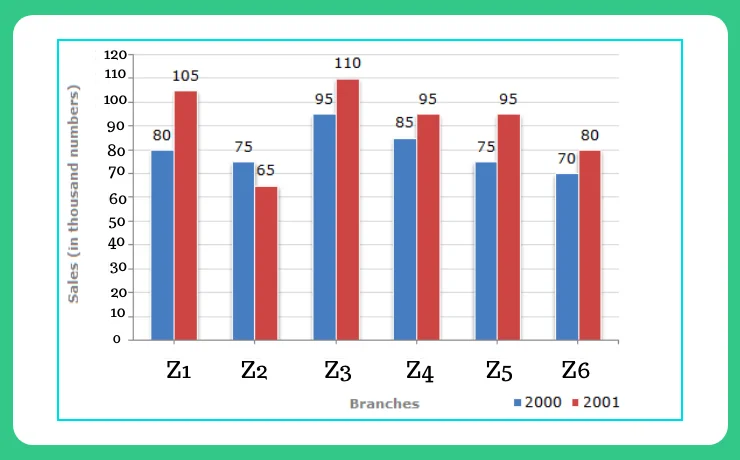
The bar graph given below shows the sales of books (in thousand number) from six branches of George Orwell publishing company during two consecutive years 2000 and 2001.

Sales of Books (in thousand numbers) from Six Branches – Z1, Z2, Z3, Z4, Z5 and Z6 of a publishing Company in 2000 and 2001.
Question 1.
What percent of the average sales of branches Z1, Z2 and Z3 in 2001 is the average sales of branches Z1, Z3 and Z6 in 2000?
Options
(A) 75%
(B) 77.5%
(C) 82.5%
(D) 87.5%
Explanations
Average sales (in thousand number) of branches Z1, Z2 and Z3 in 2001
[latex] \frac{1}{3} \ [/latex] × (105 +65 + 110) = [latex] \frac{280}{3} \ [/latex]
Average sales (in thousand number) of branches Z1, Z3 and Z6 in 2000
[latex] \frac{1}{3} \ [/latex] × (95 +80 + 70) = [latex] \frac{245}{3} \ [/latex]
∴ Required Percentage = [latex] \frac{\frac{245}{3}}{\frac{280}{3}} \times 100 [/latex] %
= [latex]\frac{245}{280}\times 100[/latex] = 87.5%
Correct Options (D)
Question 2.
Total sales of branches Z1, Z3 and Z5 together for both the years (in thousand numbers) is?
Options
(A) 250
(B) 310
(C) 435
(D) 560
Total sales of branches Z1, Z3 and Z5 for both the years (in thousand numbers)
= (80 + 105) + (95 + 110) + (75 + 95)
= 560.
Correct Options (D)
Question 3.
What is the average sales of all the branches (in thousand numbers) for the year 2000 ?
Options
(A) 73
(B) 80
(C) 83
(D) 88
Explanations
Average sales of all the six branches ( in thousand numbers) for the year 2000
= [latex] \frac{1}{6}\times [ 80 + 75 + 95 + 85 + 75 + 70][/latex]
= 80
Correct Option (B)
Question 4.
What is the ratio of the total sales of branch Z2 for both years to the total sales of branch Z4 for both years?
Options:
(A) 2:3
(B) 3:5
(C) 4:5
(D) 7:9
Explanation:
Required ratio
=[latex]\frac{(75 + 65)}{(85 + 95)}[/latex]
=[latex]\frac{140}{180}[/latex]
=[latex]\frac{7}{9}[/latex]
Correct Option (D)
Question 5.
Total sales of branch Z6 for both the years is what percent of the total sales of branches Z3 for both the years?
Options:
(A) 68.54%
(B) 71.11%
(C) 73.17%
(D) 75.55%
Explanation:
Required percentage
=[latex][\frac{(70 + 80)}{(95 + 110)}* 100]%[/latex]
=[latex][\frac{150}{205} * 100] %[/latex]
= [latex]73.17%[/latex]
Correct Option (C)
Also Check Out
Get over 200+ course One Subscription
Courses like AI/ML, Cloud Computing, Ethical Hacking, C, C++, Java, Python, DSA (All Languages), Competitive Coding (All Languages), TCS, Infosys, Wipro, Amazon, DBMS, SQL and others

Series
- Line Charts – Questions Formulas | How to Solve Quickly | Tricks & Shortcuts
- Pie Charts – Questions | Formulas | How to Solve Quickly | Tricks & Shortcuts
- Bar Charts – Questions | Formulas | How to Solve Quickly | Tricks & Shortcuts
- Radar Charts – Questions | Formulas | How to Solve Quickly | Tricks & Shortcuts

Series
- Line Charts – Questions
Formulas |
How to Solve Quickly |
Tricks & Shortcuts - Pie Charts – Questions |
Formulas |
How to Solve Quickly |
Tricks & Shortcuts - Bar Charts – Questions |
Formulas |
How to Solve Quickly |
Tricks & Shortcuts - Radar Charts – Questions |
Formulas |
How to Solve Quickly |
Tricks & Shortcuts

 Apply For Jobs
 Get Hiring Updates


Login/Signup to comment