PREPINSTA PRIME
How To Solve Data Interpretation Questions Quickly

How To Solve Data Interpretation Questions
How To Solve Data Interpretation has all type of questions on
(i) Table Chart
(ii) Pie Chart
(iii) Line Chart
(iv) Bar Chart
(v) Radar Chart
How To Solve Data Interpretation Questions
Question 1

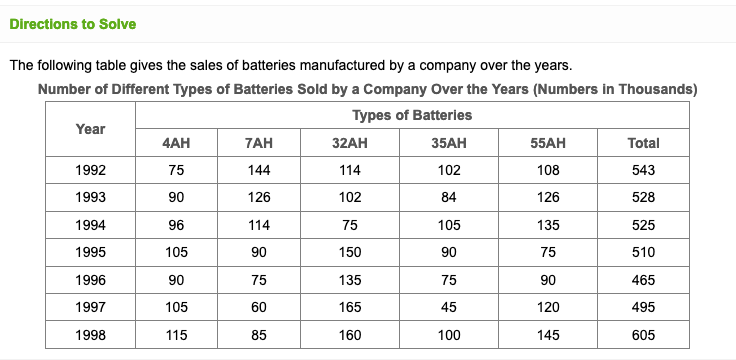
1. What was the approximate percentage increase in the sales of 55AH batteries in 1998 compared to that in 1992?
Options
A) 28%
B) 31%
C) 33%
D) 34%
Explanations
Required Percentage =
[ \frac{145-108}{108} \ * 100 ] %
= 34.6%
=34%
Correct Option D
2. The total sales of all the seven years is the maximum for which battery?
Options
A) 4AH
B) 7AH
C) 32AH
D) 35AH
Explanations
The total sales (in thousands) of all the seven years for various batteries are:
For 4AH = 75 + 90 + 96 + 105 + 90 + 105 + 115 = 676
For 7AH = 144 + 126 + 114 + 90 + 75 + 60 + 85 = 694
For 32AH = 114 + 102 + 75 + 150 + 135 + 165 + 160 = 901
For 35AH = 102 + 84 + 105 + 90 + 75 + 45 + 100 = 601
For 55AH = 108 + 126 + 135 + 75 + 90 + 120 + 145 = 799.
Clearly, sales are maximum in case of 32AH batteries.

 Apply For Jobs
 Get Hiring Updates
