PREPINSTA PRIME
How to solve Pie Charts Quickly
How to solve Pie Charts Problems Quickly in DI
Here , In this Page, How to Solve Pie Chart Questions Quickly is given.
Pie charts are a useful way to visualize information that might be presented in a small table.

How To Solve Pie Chart Questions:
Pie charts are a useful way to organize data in order to see the size of components relative to the whole, and are particularly good at showing percentage or proportional data.
Concept of Pie Chart
- Reading a pie chart is as easy as figuring out which slice of an actual pie is the biggest.
- Usually, you have several bits of data, and each is pictured on the pie chart as a pie slice. You will see that some data have larger slices than others.
- So you can easily decipher which data is more important to your audience than others.
To solve pie chart questions, follow these steps:
- Categorize the data and calculate the total.
- Divide the categories and convert them into percentages.
- Calculate the degrees of each category by multiplying the percentage by 360 and dividing by 100.
- Draw a circle of an appropriate radius and a vertical radius inside the circle.
- Choose the largest central angle and construct a sector of a central angle whose one radius coincides with the radius drawn in step 4, and the other radius is in the clockwise direction to the vertical radius.
- Calculate the central angle subtended by each category and draw the corresponding sector.
- Label each sector of the pie chart.
Prime Course Trailer
Related Banners
Get PrepInsta Prime & get Access to all 200+ courses offered by PrepInsta in One Subscription
Also Check Out
How To Solve Pie Chart in Data Interpretation Questions Quickly
Directions to solve :
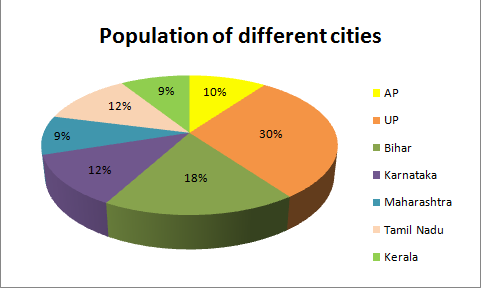
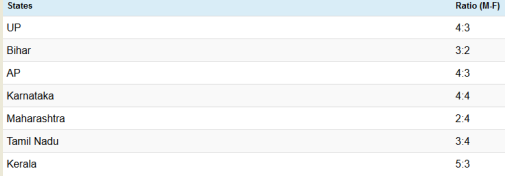
The following pie chart shows the amount of subscriptions generated for India Bonds from different categories of investors.


Question 1.Approximately what will be the percentage of total male in UP, AP and Tamil Nadu of the total population of the given states? |
(a.) 29 %
(b.) 25 %
(c.) 27 %
(d.) 28 %
Answer: Option D
Explanation:
Question 2.
Women of Andhra Pradesh is approximately what percentage of the women in Tamil Nadu ?
(a.) 65%
(b.) 63%
(c.) 53%
(d.) 58%
Explanation:
{( 3/7 * 10) / (4/7 * 12)} * 100
= 62.5
= 63%
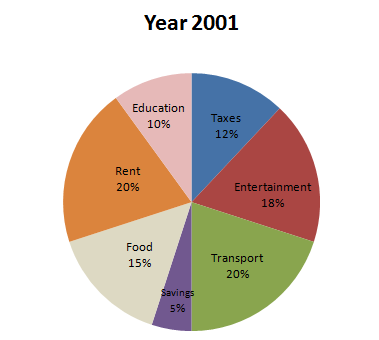
Expenditure Incurred by Mr. Sharma on Various Heads in 2001 & 2002

Total salary = Rs. 1,20,000 p.a.

Total salary = Rs. 2,40,000 p.a.
Question 3.
How much more money does Mr Gupta spend on taxes than on transport in the year 2001?
(a.) Rs 9,200
(b.) Rs 8,370
(c.) Rs ,600
(d.) Rs 8,500
Explanation:
Money spent on Taxes =12%
Money spent on Transport =20%
Difference of Taxes and Transport:
= (12-20)/100 * 1,20,000
= Rs 9,600
Directions to Solve:
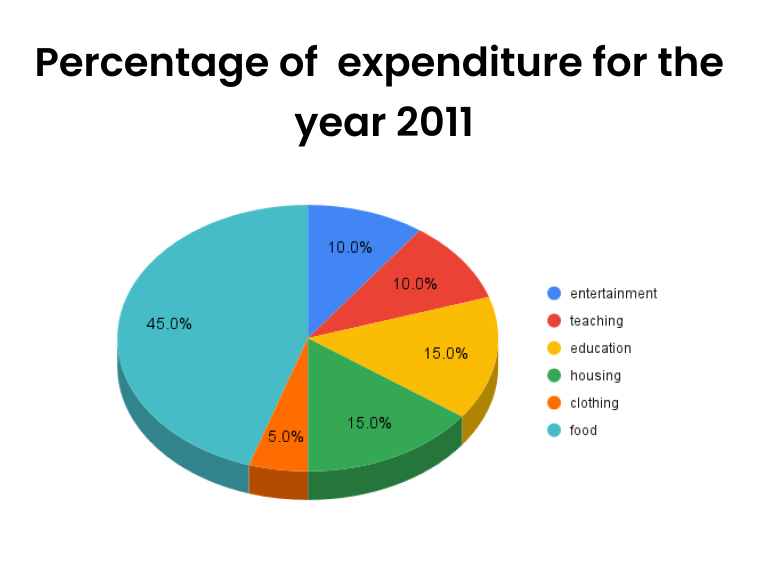
The pie chart given below shows the spending of Arvind Kejriwal’s family on different articles for the year 2011 according to data. Analyse the pie chart and answer the questions which follow.

Question 4.
Find the ratio of the amount spent by Arvind Kejriwal’s family on teaching and education to clothing and food ?
(a.) 3:2
(b.) 2:3
(c.) 1:5
(d.) 1:2
Explanation:
Required Ratio = 25% of total amt. / 50% of total amt. = 1/2
Question 5.
According to the graph, the maximum amount that was spent by Kejriwal’s family was on which item (if the expenditure that is given to be Rs. 58256)?
(a.) Food
(b.) Housing
(c.) Clothing
(d.) Others
Explanation:
Irrespective of the total expenses, the maximum will be the maximum percentage which is for food i.e. 45% of 58256.
Also Check Out
Get over 200+ course One Subscription
Courses like AI/ML, Cloud Computing, Ethical Hacking, C, C++, Java, Python, DSA (All Languages), Competitive Coding (All Languages), TCS, Infosys, Wipro, Amazon, DBMS, SQL and others

Series
- Line Charts – Questions Formulas | How to Solve Quickly | Tricks & Shortcuts
- Pie Charts – Questions | Formulas | How to Solve Quickly | Tricks & Shortcuts
- Bar Charts – Questions | Formulas | How to Solve Quickly | Tricks & Shortcuts
- Radar Charts – Questions | Formulas | How to Solve Quickly | Tricks & Shortcuts

Series
- Line Charts –
Questions
Formulas |
How to Solve Quickly |
Tricks & Shortcuts - Bar Charts –
Questions |
Formulas |
How to Solve Quickly |
Tricks & Shortcuts - Radar Charts –
Questions |
Formulas |
How to Solve Quickly |
Tricks & Shortcuts

 Apply For Jobs
 Get Hiring Updates


