Quants Menu
- HCF and LCM
- Number System
- Number Decimals & Fractions
- Surds and Indices
- Divisibility
- Ages
- LCM
- HCF
- Inverse
- Speed Time and Distance
- Work and Time
- Boats and Streams
- Pipes and Cisterns
- Averages
- Allegations and Mixtures
- Ratio and Proportions
- Simple & Compound Interest
- Simple Interest
- Compound Interest
- Percentages
- Profit & Loss
- Successive Discount 1
- Successive Discount 2
- AP GP HP
- Arithmetic Progressions
- Geometric Progressions
- Harmonic Progressions
- Probability
- Permutation & Combination
- Combination
- Circular Permutation
- Geometry
- Heights and Distances
- Perimeter Area and Volume
- Coordinate Geometry
- Venn Diagrams
- Set Theory
- Algebra
- Linear Equations
- Quadratic Equations
- Logarithms
- Clocks
- Calendars
- Clocks and Calendars
- Finding remainder of large powers
PREPINSTA PRIME
Formulas For Venn Diagrams
Formulas For Venn Diagrams
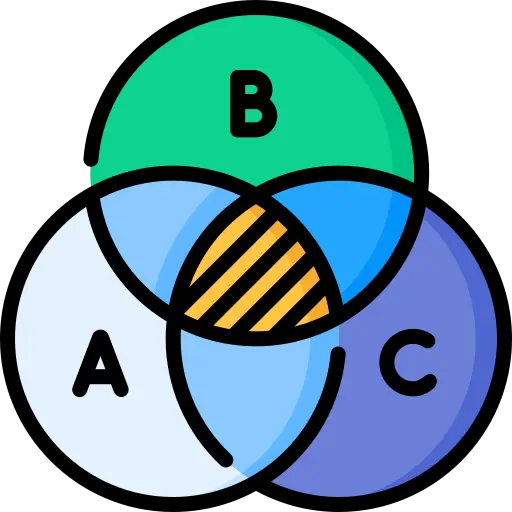
Basic Formula for the Venn Diagram
- Some basic formulas for Venn diagrams of two and three elements.
- n ( A ∪ B) = n(A ) + n ( B ) – n ( A∩ B)
- n (A ∪ B ∪ C) = n(A ) + n ( B ) + n (C) – n ( A ∩ B) – n ( B ∩ C) – n ( C ∩ A) + n (A ∩ B ∩ C)
- And so on, where n( A) = number of elements in set A.
- After understanding the concept the of venn diagram with diagram, we don’t have to remember the formulas.
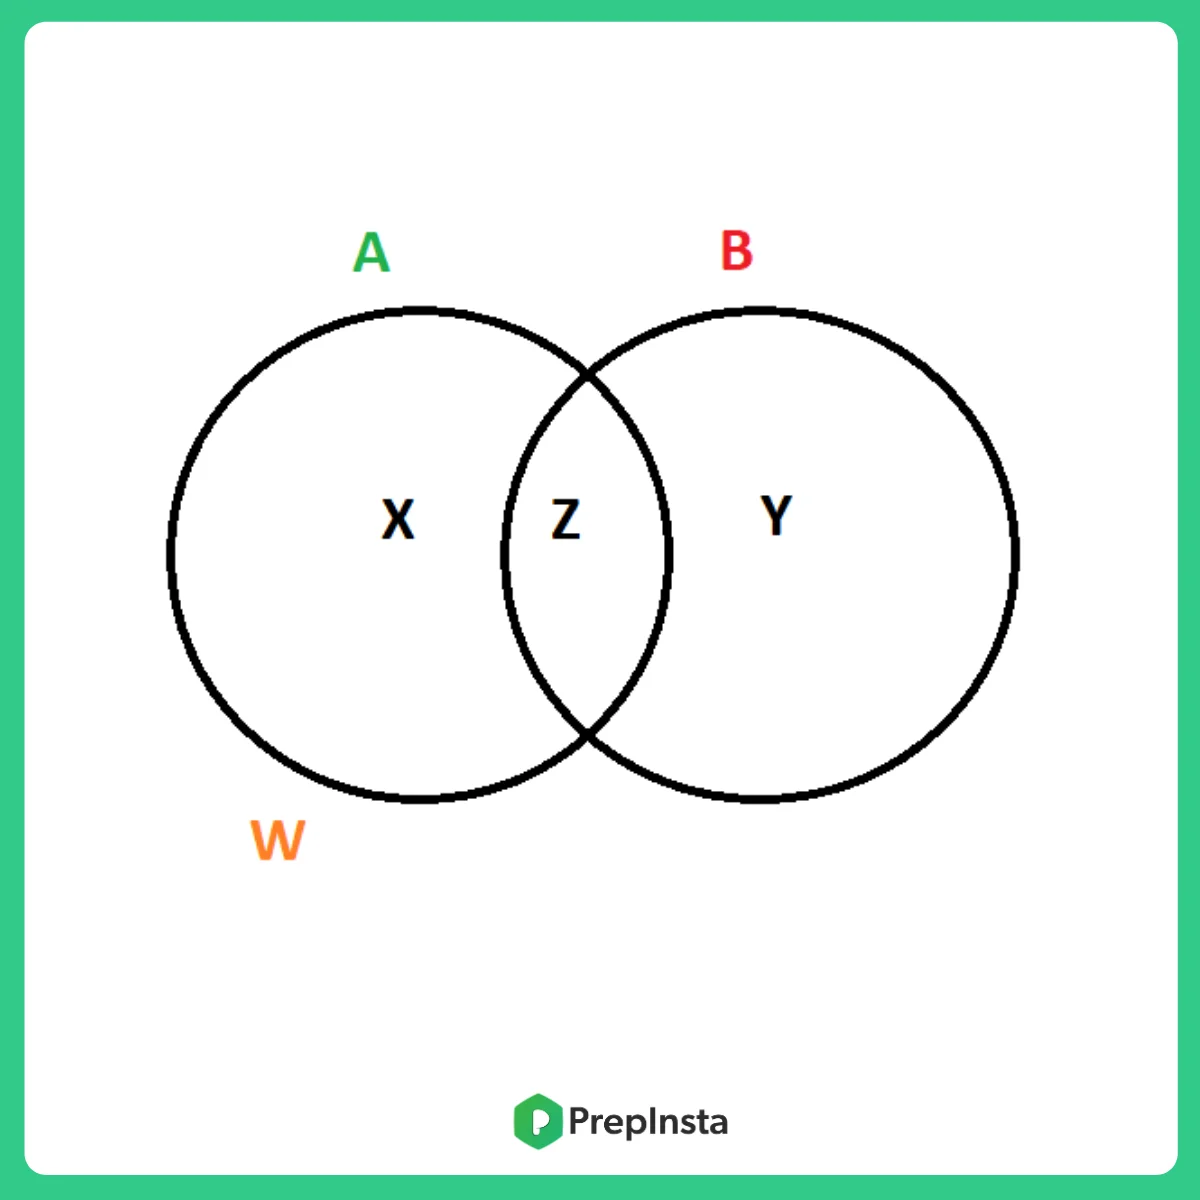
Venn Diagram for 2 sets
n ( A ∪ B) = n(A ) + n ( B ) – n ( A∩ B)
Where;
X = number of elements that belong to set A only
Y = number of elements that belong to set B only
Z = number of elements that belong to set A and B both (A ∩ B)
W = number of elements that belong to none of the sets A or B
From the above figure, it is clear that
n(A) = x + z ;
n (B) = y + z ;
n(A ∩ B) = z;
n ( A ∪ B) = x +y+ z.
Total number of elements = x + y + z + w
Prime Course Trailer
Related Banners
Get PrepInsta Prime & get Access to all 200+ courses offered by PrepInsta in One Subscription
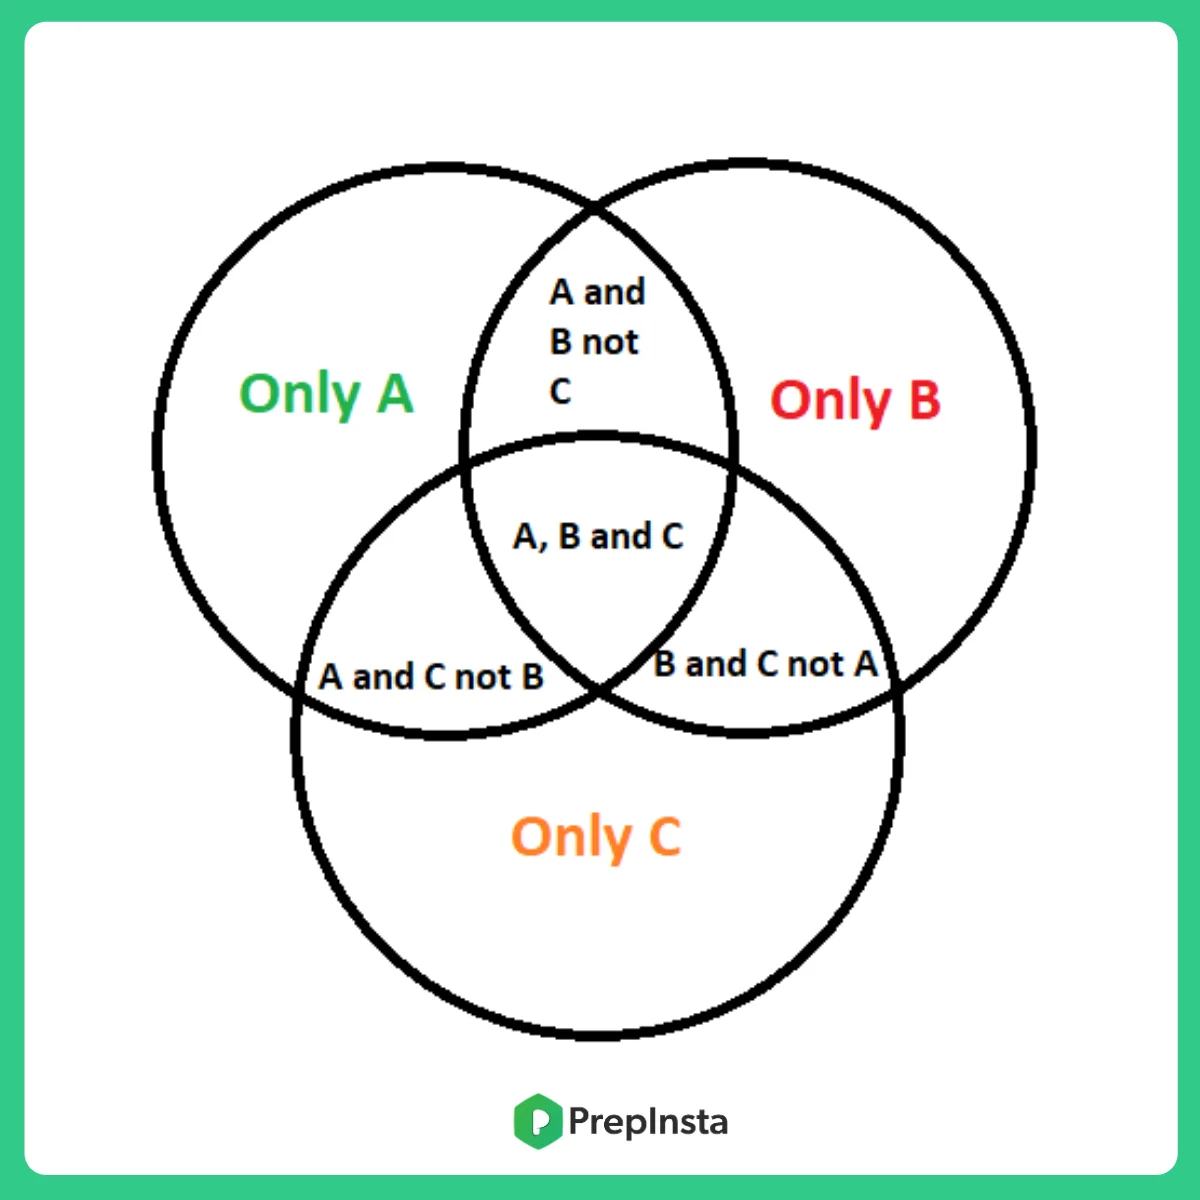
Venn Diagram for 3 sets
n (A ∪ B ∪ C) = n(A ) + n ( B ) + n (C) – n ( A ∩ B) – n ( B ∩ C) – n ( C ∩ A) + n (A ∩ B ∩ C)
Where, W = number of elements that belong to none of the sets A, B or C
Some Examples Based On Above Formulas:
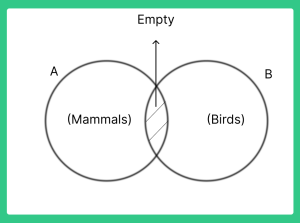
Question 1: In a Venn diagram representing animals, if Set A represents mammals and Set B represents birds, what does the overlapping region between A and B signify?
Answer: The overlapping region between Set A (mammals) and Set B (birds) signifies the animals that are both mammals and birds. In the context of real animals, this region would be empty since mammals and birds are distinct categories.
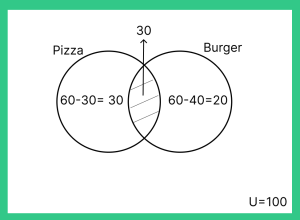
Question 2: In a survey of 100 people, 60 like pizza, 40 like burgers, and 30 like both pizza and burgers. Draw a Venn diagram to represent this data and find out how many people do not like either pizza or burgers.
Answer: In the Venn diagram representing the survey data, the number of people who do not like either pizza or burgers can be calculated as follows: Total people – (Number of people who like pizza + Number of people who like burgers – Number of people who like both pizza and burgers) 100 – (60 + 40 – 30) = 100 – 70 = 30 people
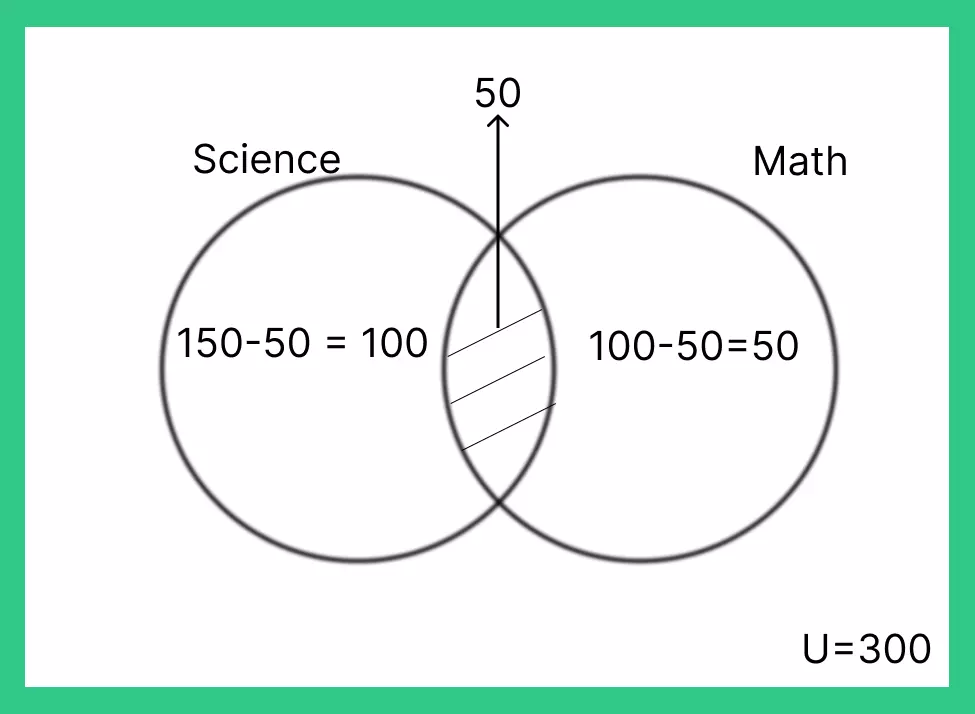
Question 3: In a school with 300 students, 150 study Science, 100 study Math, and 50 students study both Science and Math. Draw a Venn diagram to illustrate the situation and determine how many students study only one of the subjects.
Answer: In the Venn diagram representing the school subjects, the number of students who study only one of the subjects can be calculated as follows: (Number of students studying Science – Number of students studying both Science and Math) + (Number of students studying Math – Number of students studying both Science and Math) (150 – 50) + (100 – 50) = 150 students
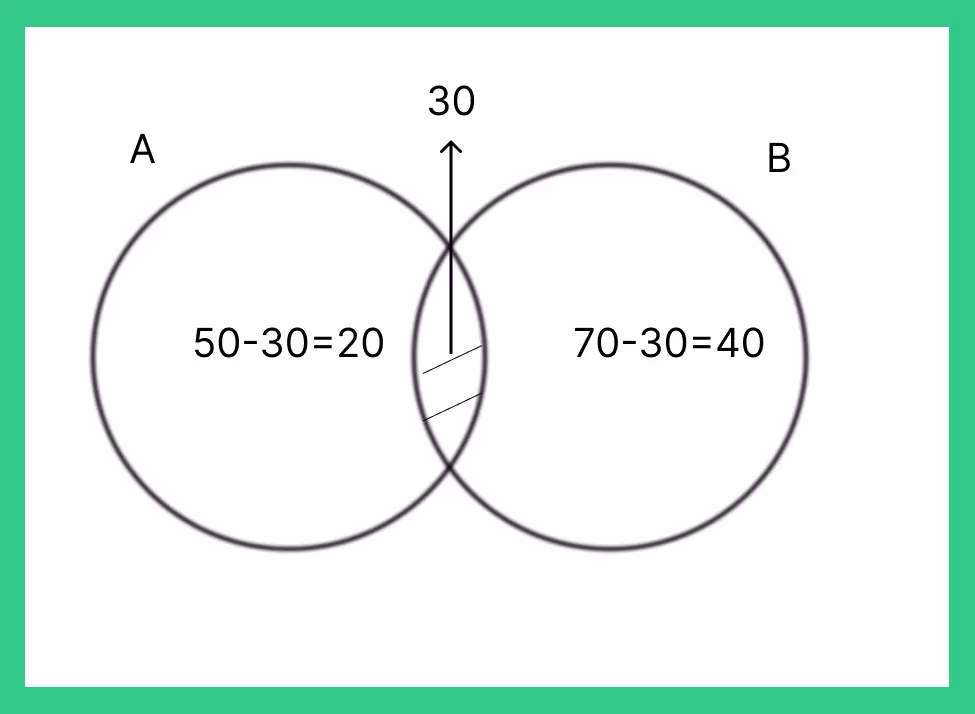
Question 4: In a Venn diagram with two sets, A and B, if the total number of elements in Set A is 50 and the total number of elements in Set B is 70, and the two sets have 30 elements in common, how many elements are there in the union of sets A and B?
Answer: The number of elements in the union of sets A and B can be calculated as follows: Total elements in Set A + Total elements in Set B – Number of elements in the intersection of sets A and B 50 + 70 – 30 = 90 elements
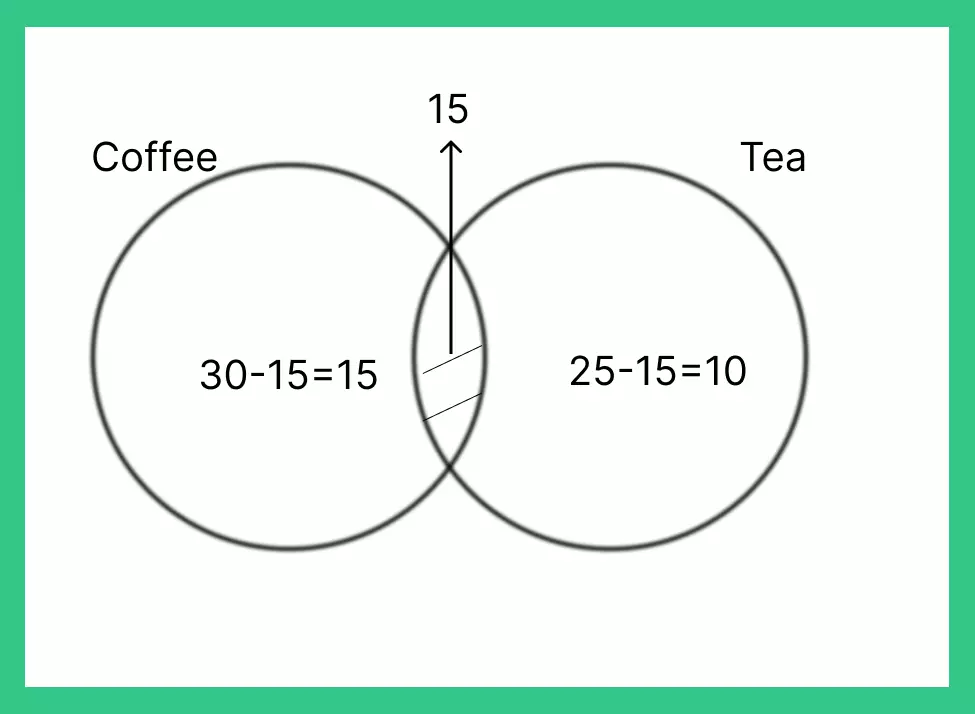
Question 5: In a group of 50 people, 30 people like coffee, 25 people like tea, and 15 people like both coffee and tea. How many people do not like either coffee or tea?
Answer: Number of people who do not like either coffee or tea = Total number of people – (Number of people who like coffee + Number of people who like tea – Number of people who like both coffee and tea)
Using the given data: Total number of people = 50 Number of people who like coffee = 30 Number of people who like tea = 25 Number of people who like both coffee and tea = 15
Number of people who do not like either coffee or tea = 50 – (30 + 25 – 15) = 50 – 40 = 10
So, there are 10 people who do not like either coffee or tea.
Also Check Out
Get over 200+ course One Subscription
Courses like AI/ML, Cloud Computing, Ethical Hacking, C, C++, Java, Python, DSA (All Languages), Competitive Coding (All Languages), TCS, Infosys, Wipro, Amazon, DBMS, SQL and others
- Geometry – Questions | Formulas | How to Solve Quickly | Tricks & Shortcuts
- Heights and Distances – Questions | Formulas | How to Solve Quickly | Tricks & Shortcuts
- Perimeter Area and Volume – Questions | Formulas | How to Solve Quickly | Tricks & Shortcuts
- Coordinate Geometry – Questions | Formulas | How to Solve Quickly | Tricks & Shortcuts
- Set Theory – Questions | Formulas | How to Solve Quickly | Tricks & Shortcuts
- Geometry – Questions |
Formulas |
How to Solve Quickly |
Tricks & Shortcuts - Heights and Distances – Questions |
Formulas | - How to Solve Quickly |
Tricks & Shortcuts - Perimeter Area and Volume – Questions |
Formulas |
How to Solve Quickly |
Tricks & Shortcuts - Coordinate Geometry – Questions |
Formulas |
How to Solve Quickly |
Tricks & Shortcuts - Set Theory – Questions |
Formulas |
How to Solve Quickly |
Tricks & Shortcuts

 Apply For Jobs
 Get Hiring Updates


Login/Signup to comment